In the digital age, data is omnipresent and omnipotent, shaping the way we understand and interact with the world around us. My role as a Data Scientist at dPO Technologies has been to make sense of this data, to tell its story in a way that is both insightful and actionable. Through the creation of user dashboards, I’ve illuminated paths for business optimization and growth that resonate with our stakeholders.
A Week in Numbers: Navigating Business Health
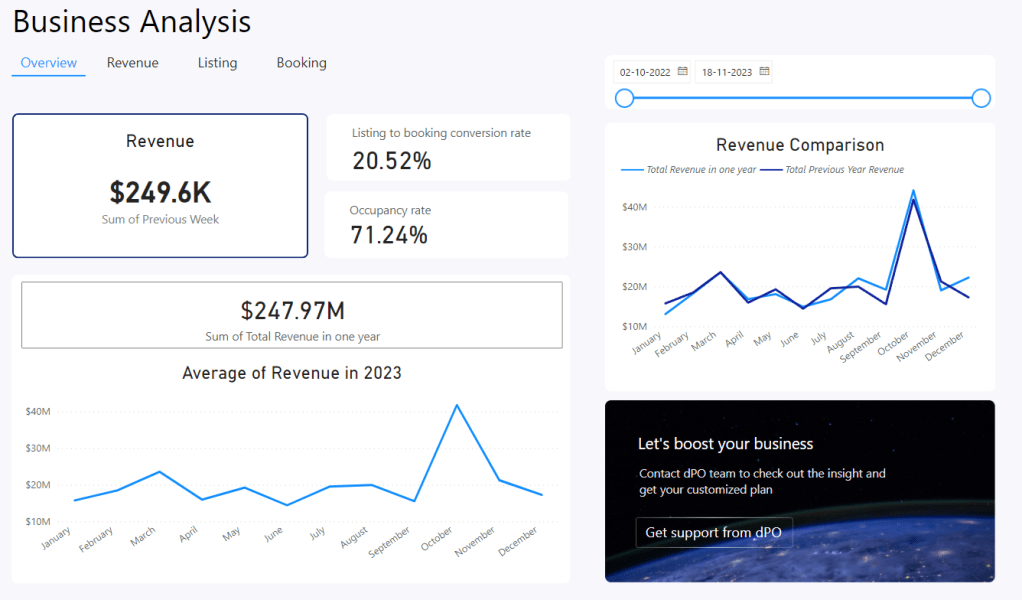
One of my projects was to create a dashboard that served as a week-to-week health check for our business operations. It provided a snapshot of revenue streams, highlighting a sum of $2.6K in the previous week. By tracking these short-term fluctuations, we could fine-tune our marketing and operational strategies in almost real-time.
The Conversion Narrative: From Browsers to Buyers
Perhaps one of the most crucial aspects of our business model is the conversion rate—the pivotal point turning interest into revenue. I developed a dashboard that distilled complex user interactions into a simple yet powerful metric: the listing to booking conversion rate. At 20.52%, this figure became a benchmark for our performance, a number that we aimed to improve through various customer engagement and UX initiatives.
The Occupancy Odyssey: Maximizing Use of Space
In a business where space is the product, occupancy rates are king. My dashboards provided a vivid depiction of occupancy at 71.24%, offering a clear indicator of our utilization of assets. This metric informed our decisions on where to focus our acquisition efforts and how to adjust our pricing strategy.
Annual Reflections: Yearly Revenue in Retrospect
Looking at the broader horizon, I created a dashboard that presented an annual view of our revenue. With a sum of $2.97M in total revenue for the year, and a peak in November, we could identify and analyze the trends that defined our fiscal year. This holistic perspective helped us to prepare for future cycles and to plan for long-term growth.
The Forward-Look: Boosting Business with Data
Finally, I included a call to action within the dashboards, a subtle nudge for the users to ‘Get support from dPO.’ This wasn’t just about offering help; it was about closing the loop, ensuring that the insights gained from these dashboards could be translated into strategies and solutions tailored to each client’s needs.

Leave a comment