
Revenue forecasting is a cornerstone for business strategy, enabling organizations to allocate resources, set budgets, and predict market trends. While traditionally complex and resource-intensive, forecasting workflows are now being transformed by platforms like Microsoft Fabric, which integrate data engineering, machine learning, and business intelligence into a unified ecosystem.
In this blog, we’ll delve into a revenue forecasting project powered by Microsoft Fabric, showcasing how it simplifies the end-to-end workflow from data ingestion to actionable insights, including the creation of Power BI dashboards within the platform.
Microsoft Fabric: A Seamless Analytics Hub
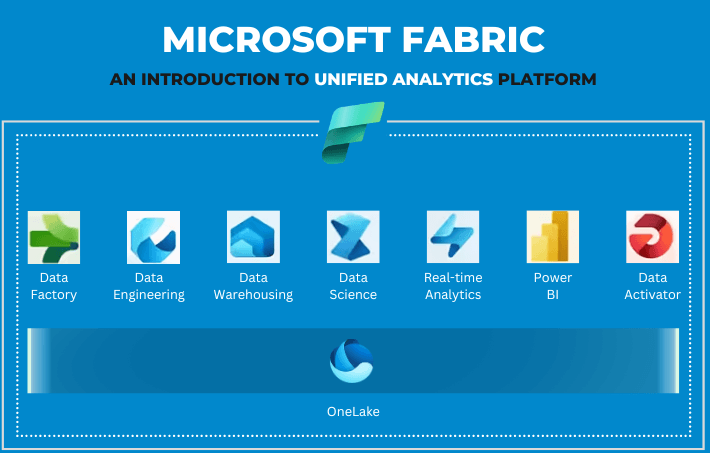
Microsoft Fabric is designed to unify the data lifecycle by combining data storage, analysis, and visualization capabilities. Key highlights include:
- Lakehouse Integration: A scalable and efficient repository for structured and unstructured data.
- Notebook Support: Build, run, and refine Python- or PySpark-based workflows directly within the platform.
- Power BI Integration: Seamlessly connect forecasting outputs to interactive dashboards for real-time decision-making.
- Collaborative Environment: Share notebooks, reports, and datasets across teams with built-in collaboration tools.
The Forecasting Task: Monthly Revenue Prediction
This project focused on predicting monthly revenue using historical data. Here’s how Microsoft Fabric’s capabilities streamlined each step of the process:
- Data Preparation
Fabric lakehouses acted as the centralized repository for raw revenue data. Using Python notebooks:- The data was transformed into a time-series format suitable for forecasting.
- Advanced feature engineering, such as calculating seasonal and trend components, was performed to capture revenue patterns effectively.
- Data exploration and validation were accelerated using Fabric’s interactive widgets, which provided immediate feedback on transformations.
- Model Development
With Fabric’s support for popular machine learning libraries:- Models like ARIMA and Gradient Boosting were trained to predict future revenue.
- Hyperparameter tuning and cross-validation were efficiently handled using Fabric’s scalable compute capabilities.
- Model performance was evaluated using metrics such as Mean Absolute Percentage Error (MAPE), ensuring that forecasts were both accurate and reliable.
- Exporting Forecasts to Delta Tables
Once the forecasted revenue values were generated, they were stored in a delta table within Fabric’s lakehouse. This served as a dynamic and queryable dataset, ready for downstream consumption by business intelligence tools. - Creating Power BI Dashboards within Fabric
The exported delta table was directly integrated into Power BI, enabling the creation of rich, interactive dashboards:- Forecasted and actual revenues were visualized side by side, providing clarity on trends and deviations.
- Key performance indicators (KPIs) such as forecast accuracy and growth rates were highlighted to facilitate strategic discussions.
- Stakeholders could access and explore the dashboards within the Fabric environment, fostering real-time decision-making and collaboration.
Why Microsoft Fabric for Forecasting and Visualization?
Microsoft Fabric’s integrated ecosystem is tailor-made for tasks like revenue forecasting:
- Unified Workflow: Transition seamlessly from raw data to predictive analytics to business intelligence within a single platform.
- Delta Table Integration: Serve up forecasted results in a scalable, query-friendly format for analytics and reporting tools.
- Scalable Compute Power: Handle large datasets and complex models without compromising on performance.
- Built-in Visualization: Leverage the full power of Power BI directly within Fabric for interactive and actionable dashboards.
Driving Business Decisions with Fabric
The ability to connect machine learning forecasts directly to business intelligence tools like Power BI within the Fabric ecosystem is a game-changer. In this project, the integration of forecasted revenue data into interactive dashboards empowered decision-makers with:
- Clear insights into revenue trends and predictions,
- Metrics to evaluate the accuracy and impact of forecasts,
- The ability to drill down into granular details for deeper analysis.
Closing Thoughts
Closing Thoughts
Microsoft Fabric redefines how organizations approach forecasting and analytics. By combining robust data engineering, machine learning, and visualization tools, it enables teams to:
- Build accurate and scalable forecasting models,
- Share results seamlessly across stakeholders,
- Derive actionable insights through interactive dashboards.
If your organization is looking to streamline analytics workflows and unlock the potential of integrated forecasting and reporting, Microsoft Fabric is a platform worth exploring.

Leave a comment